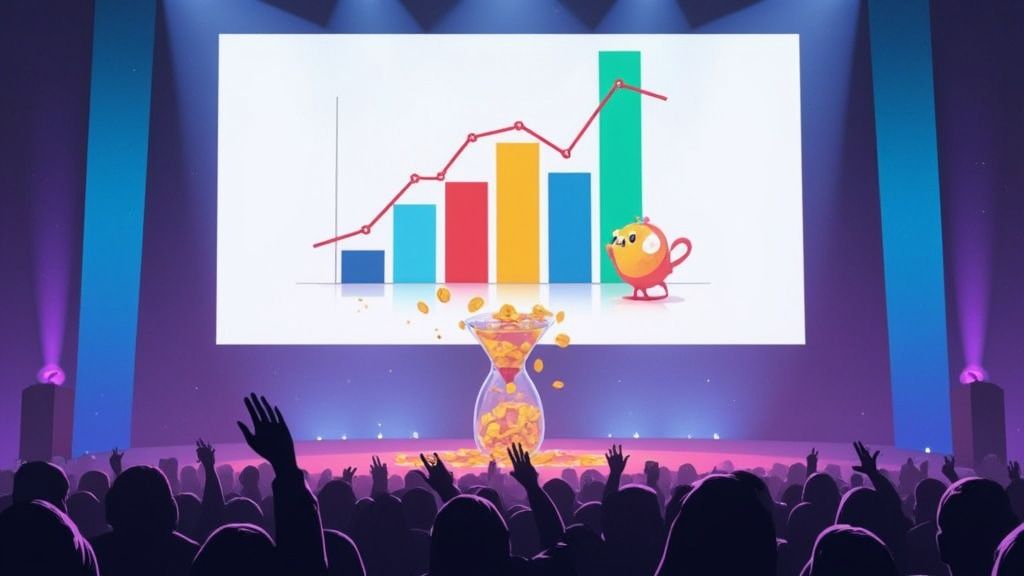
We use the term "return on investment" or ROI to talk about the net value an event generates compared to what it cost to produce. It's a simple idea, but it's the one thing that turns your event from a line-item expense into a strategic, measurable part of the business.
Basically, it answers the big question every boss wants to know: Was this whole thing worth the time, money, and effort we poured into it?
Why Proving Event ROI Is No Longer Optional
Gone are the days when a packed room and a few happy tweets were enough to call an event a win. Today's leadership teams live and breathe data. Every dollar in the marketing budget has to pull its weight, and events - which can eat up a huge chunk of that budget - are getting the same hard look as every other channel.
This means we, as event professionals, have to think differently.
Your event isn't just a one-off expense. It's an investment portfolio. The venue rental, the speaker fees, the social media ads... every single one is an investment that needs to contribute to an overall positive return. Proving that return isn't a "nice-to-have" anymore. It's essential for getting your budget approved next year and showing how much value your team really brings to the table.

Shifting from Cost Center to Revenue Engine
For too long, events were just filed away as a "cost of doing business." That's a dangerously outdated way of thinking. When you can't show hard numbers, you have no defense when budgets get cut, and you can't make a case for that bigger, more ambitious event you know you should be running.
When you start systematically tracking the return on investment from your events, you completely change the conversation. Suddenly, your event isn't a cost center. It's a predictable revenue engine. At Add to Calendar PRO, we understand this pressure. Our service is built around that critical first step of any successful event: actually getting people to show up.
Measuring event ROI is about learning to speak the language of the C-suite. When you can walk into a meeting and show that for every $1 spent on the annual conference, the company generated $5 in new sales pipeline, you’re not just an event planner. You’re a strategic partner.
The Core Components of Your Event Investment
To figure out your return, you first have to get a handle on both sides of the equation: your investments (costs) and your returns (value). You need to be thorough here to get a true picture.
Let's break down what goes into each side of your event ROI calculation. The table below outlines the common costs you'll encounter and the valuable returns you should be tracking against them.
| Investment Area (Cost) | Potential Return (Value) | Example Metric |
|---|---|---|
| Venue & Logistics | Ticket Sales & Direct Revenue | Total Revenue from Registrations |
| Marketing & Promotion | Lead Generation | Number of Marketing Qualified Leads (MQLs) |
| Technology & Platforms | Sales Pipeline Growth | Dollar Value of Opportunities Created |
| Staff & Speaker Fees | Brand Awareness & Reach | Social Media Mentions & Impressions |
| Content & Production | Customer Loyalty & Retention | Post-Event Survey Satisfaction Score |
| Sponsorships | Partner & Ecosystem Development | Number of New Strategic Partnerships |
This framework isn't just about counting beans. It's about connecting every dollar you spend to a tangible business outcome. Once you have this clear view, you're armed with the data you need to prove the massive impact of your events and secure the resources to make them even better.
The Essential Formulas for Calculating Event ROI
Let's be honest, you don't need a math Ph.D. to figure out your event's return on investment. At its heart, it's a simple comparison: what did we get back versus what did we put in? Nailing this basic formula is your first step to speaking the language of data - the language your stakeholders really care about.
The most fundamental formula you'll ever need for event ROI is refreshingly straightforward:
Event ROI % = (Net Profit / Total Investment) x 100
This little equation spits out a clear percentage that shows exactly how much bang you got for your buck. A result of 200%, for instance, means you made two dollars in profit for every single dollar you spent. It’s a powerful number that instantly tells the story of your event's success.
Breaking Down Total Investment
Before you can even think about profit, you need a painfully honest look at your total investment. This means accounting for every single cost, from the big, obvious ones to the sneaky ones that hide in the details. Getting this right is critical; if you underestimate your costs, you’ll end up with a puffed-up, misleading ROI.
Your total investment, which you can just call Total Costs, is a mix of all kinds of expenses.
- Venue Costs: The rent for your physical space or virtual platform.
- Speaker and Talent Fees: What you paid your presenters, entertainers, or special guests.
- Marketing and Promotion: Every dollar spent on social ads, email campaigns, and getting the word out.
- Technology and Platforms: The bill for your registration software, event app, or streaming services.
- Staffing and Labor: Don't forget this one! It includes your event-day staff and the hours your own team poured into planning and running the show.
- Swag and Materials: The cost of printed goodies, attendee gifts, and any other physical items.
For example, a one-day hybrid conference might have a $50,000 total investment. That could break down into $20,000 for the venue, $10,000 in speaker fees, $12,000 for marketing, and $8,000 for all the tech and people power. Track every line item. No cheating.
Calculating Your Net Profit
Once you have your total investment tallied up, the next piece of the puzzle is your Net Profit. This isn't just your revenue - it's what’s left in the pot after you’ve paid for everything.
The formula here is just as simple:
Net Profit = Total Revenue - Total Costs
Total revenue is all the money that came in because of the event. Think ticket sales, registration fees, sponsorship deals, and maybe even merch sales. If that same conference with the $50,000 investment brought in $150,000 in total revenue, your net profit is a cool $100,000.
Putting It All Together: A Practical Example
Okay, let's plug those numbers back into our original ROI formula and see it in action.
- Calculate Net Profit:
- Total Revenue: $150,000
- Total Investment (Costs): $50,000
- Net Profit: $150,000 - $50,000 = $100,000
- Calculate Event ROI:
- Net Profit: $100,000
- Total Investment: $50,000
- ROI % = ($100,000 / $50,000) x 100 = 200%
This result gives you a clean, defensible number that proves the event was a financial win. Mastering this calculation is the foundation for proving your value, but it's really just the beginning. For a deeper look at other crucial KPIs, check out our complete guide on how to measure event success. It will help you build a much richer story around your event's performance.
Tracking the Metrics That Tell Your Event's Full Story
That core ROI formula gives you a powerful headline number, but let's be honest - it doesn’t tell the whole story. To truly grasp the return on investment of events, you need to look beyond a single percentage. It's about weaving together a rich narrative from a whole host of metrics, covering everything from budget efficiency and audience buzz to brand impact and, of course, sales.
Relying on one formula is like knowing the final score of a game without seeing any of the incredible plays that led to the win. To really understand your event's performance, you need to watch the full highlight reel. That means tracking key performance indicators (KPIs) across several categories to build a complete picture of the value you've created.
This infographic breaks down the fundamental pieces of event ROI, showing how profit and investment are the two core pillars of your calculation.
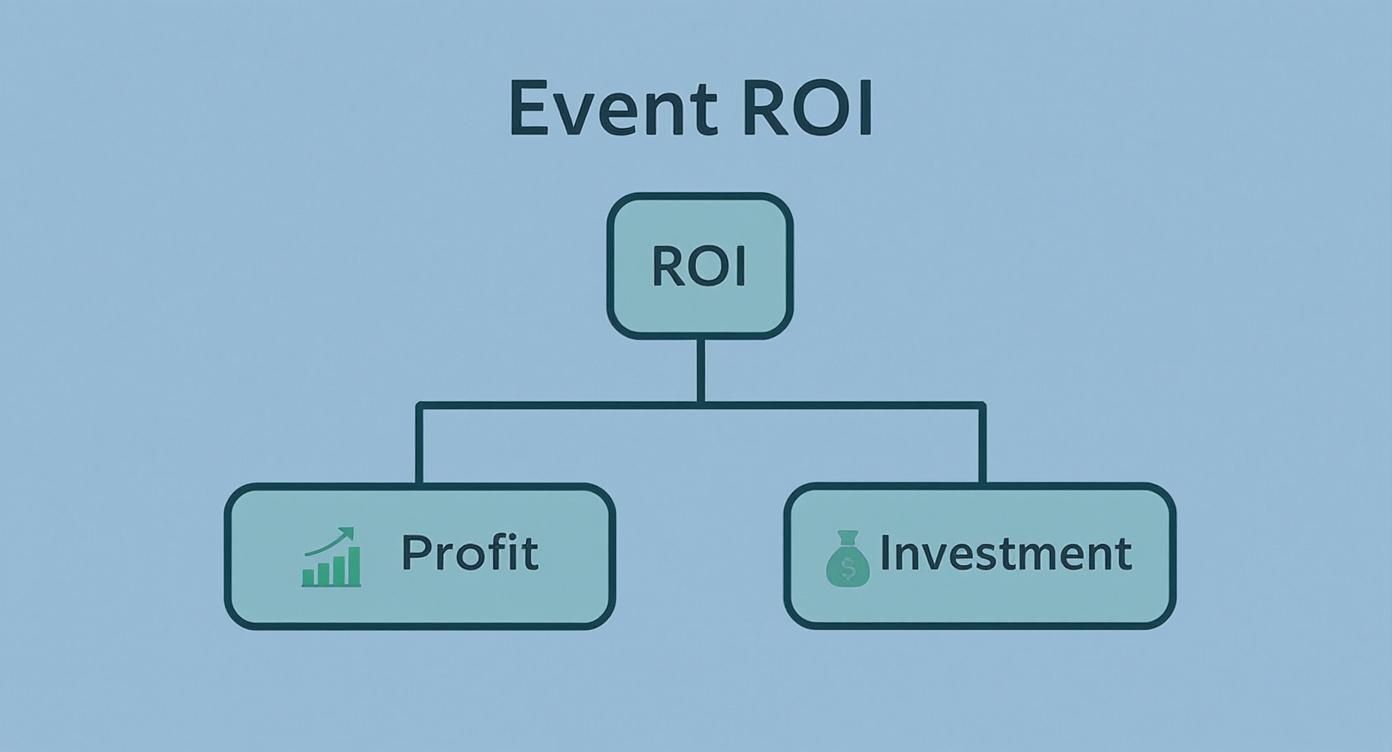
As you can see, a successful return is always a balancing act between maximizing the value you generate (profit) and keeping a tight rein on the resources you spend (investment).
Gauging Financial Efficiency
Beyond the main ROI calculation, a few key financial metrics can tell you how efficiently you used your budget. These KPIs help you figure out just how cost-effective your event was as a marketing channel.
- Cost Per Lead (CPL): This one is simple but powerful. It tells you exactly how much it cost to get one lead from your event. Just divide your total event investment by the number of leads you captured. A low CPL compared to your other channels is a massive win.
- Customer Acquisition Cost (CAC): Taking CPL a step further, CAC calculates what it cost to land an actual paying customer. Divide your total event investment by the number of attendees who became customers. This is a critical number for proving your event’s direct contribution to business growth.
Measuring Audience Engagement
An engaged audience is a valuable one. These metrics measure how captivated your attendees were, which is often a fantastic predictor of future brand loyalty and sales.
Engagement is the currency of modern events. It signals that you didn't just host an event; you created an experience that resonated with people on a deeper level, making them more receptive to your message.
A few key engagement indicators to watch:
- Social Media Mentions: Keep an eye on your event hashtag and brand mentions to see how much buzz you generated online. A ton of engagement shows your event’s message spread far beyond the venue walls.
- Session Dwell Times: For virtual or hybrid events, how long did people stick around in specific sessions? Longer dwell times are a dead giveaway that you had high-quality, relevant content that held their attention.
- Attendance Rate: This is a fundamental but crucial metric. A high attendance rate - which our service directly helps to improve by getting events onto calendars - shows strong pre-event interest and that your promotion worked. You can dive deeper with our guide on powerful event attendance tracking.
Assessing Brand Impact
Some of the most significant returns aren't immediately financial. Events are powerful tools for building brand awareness and shifting how people see you.
Metrics for brand impact include:
- Website Traffic Surges: Did your website see a big jump in visitors during and right after the event? That’s a clear sign the event successfully drove interest back to your brand.
- Media Impressions: This is the total number of times your brand was seen in media coverage related to the event. It’s a classic PR metric that puts a number on your reach.
Connecting Events to the Bottom Line
Finally, you have to connect the dots between your event and actual sales. This is where you prove that your event wasn't just a great experience - it was a revenue-driver.
- Sales Pipeline Influence: How many new sales opportunities popped up as a direct result of the event? Track the total dollar value of these opportunities to show the potential future revenue you've lined up.
- Attributed Closed Deals: This is the ultimate metric. Work with your sales team to pinpoint how many deals were closed with customers who were at your event. Tying this revenue back directly demonstrates undeniable ROI.
Actionable Strategies to Boost Your Event ROI
Knowing your numbers is the first step. But actually improving them? That takes deliberate action.
Maximizing your event ROI isn't about some single, magic trick. It’s about being smart and strategic before, during, and after your event to squeeze more value out of every stage.
Think of it like investing in the stock market. You don't just throw money at one stock and hope for the best. The UBS Global Investment Returns Yearbook shows that long-term success comes from consistent, disciplined decisions and diversification. The same exact principle applies to your events. A solid strategy across the entire event lifecycle will always outperform a last-minute scramble in one area.
Before the Event Starts
The foundation for a high-ROI event is poured weeks, or even months, before the doors ever open. This is your chance to build momentum, lock in revenue, and make sure you have an excited, engaged audience on day one.
- Create Strategic Sponsorship Packages: It's time to move beyond just slapping a logo on a banner. Offer sponsors things they actually want - valuable, data-rich opportunities. Let them sponsor a lead-capture poll, host a branded networking session, or get their content featured in your pre-event emails. This flips sponsorship from a passive ad buy into an active lead-gen tool for them, making it much easier to justify a bigger check.
- Launch Targeted Social Media Campaigns: Don’t just announce your event; start a conversation. Use targeted ads on platforms like LinkedIn to reach specific job titles or industries. Run early-bird discount campaigns to get those first ticket sales rolling in. Share behind-the-scenes content to build real excitement. Every single "like" and "share" is a touchpoint warming up potential attendees.
- Ensure Attendees Actually Show Up: A huge registration list is just a vanity metric if nobody shows up. This is where getting your event onto your audience's personal calendars is completely non-negotiable. Using our service, Add to Calendar PRO, ensures that the moment someone registers, that event is locked into their schedule. This one simple step can dramatically slash your no-show rates and protect the "return" side of your ROI equation.
During the Event
Once the event kicks off, your focus has to shift to engagement and data capture. Every interaction is a chance to deliver value to attendees while collecting the insights that prove your event was a success.
The real magic happens when you turn passive attendees into active participants. Engagement isn't just a "nice-to-have" metric; it's a direct line to capturing higher quality leads and creating memorable brand experiences.
Technology is your best friend here:
- Implement Live Polls and Q&A Sessions: Use tools like Slido or Mentimeter during keynotes or panels to keep the audience hooked. More importantly, the data you get back is pure gold for lead qualification. A simple poll asking, "What is your biggest marketing challenge?" instantly segments your audience for perfect post-event follow-up.
- Leverage Networking Apps: Encourage attendees to connect with each other - and your sponsors - through a dedicated event app like Whova or Hopin. Features that allow attendees to pre-schedule meetings with your sales reps can directly fill your pipeline. It’s one of the most direct ways to generate a tangible return right there on the event floor.
After the Event Ends
The work isn't over when the lights go down. The post-event phase is where you turn all that buzz and engagement into actual business results. A weak follow-up strategy can completely waste all your hard work.
Your most powerful tool here is a segmented lead nurturing sequence. Don't you dare send the same generic "thank you" email to everyone. Instead, tailor your communication based on the data you collected.
Did someone attend a session on a specific topic? Send them a deep-dive whitepaper on it. Did they visit a particular sponsor's booth? Make sure that sponsor's team follows up personally. This follow-through is what transforms a one-time event into a long-term revenue engine. For a more detailed breakdown, check out our complete guide on calculating event marketing ROI.
How to Report Event ROI to Stakeholders
You’ve done the hard work of gathering all the data. That’s a huge win, but you're not at the finish line just yet.
The numbers you've collected are only as powerful as the story they tell. If you want to secure next year's budget and prove your event was more than just a "nice-to-have," you need to translate that data into a clear, compelling narrative for your execs, sponsors, and other stakeholders.
Think of your ROI report as the final pitch. A messy spreadsheet of raw numbers isn't going to impress anyone or get them to open their wallets. Your real goal is to create a persuasive, easy-to-digest story that connects every dollar spent to a meaningful business outcome.
Building a Persuasive Reporting Framework
A powerful ROI report is more than just a data dump; it provides context, analysis, and a clear story. You want to walk your stakeholders through the event's journey - from initial investment to final return - making the value so obvious it's impossible to ignore. A solid report always includes these core pieces.
1. Executive Summary: Lead with the bottom line. This is your one-page, at-a-glance overview highlighting the most critical findings. Start with the final ROI percentage, key achievements, and major takeaways right up front. It’s perfect for busy executives who might not read the whole thing.
2. Recap of Event Goals: Briefly remind everyone what you set out to do in the first place. This frames your results against the original objectives, proving your team isn’t just busy - it's strategically effective.
3. Key Performance Indicators (KPIs): This is where you present your most important metrics, but don't just list them. Give them context. For example, instead of just saying "150 leads," you’d say, "Generated 150 qualified leads, adding $75,000 to the sales pipeline."
Your report should tell a story of value. Each data point is a character, and your narrative should explain how they worked together to produce a successful outcome for the business.
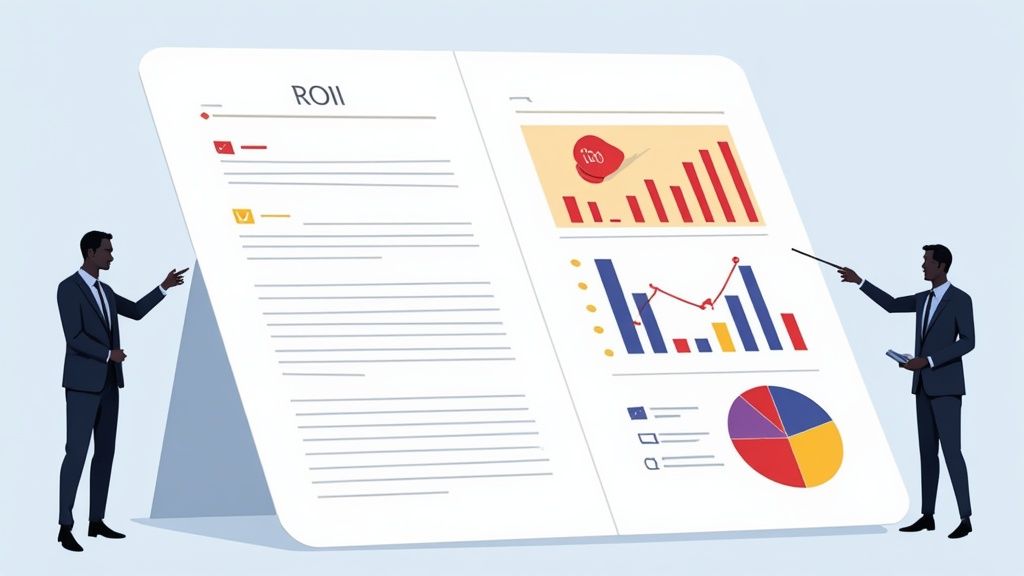
Visualizing Data for Maximum Impact
Let's be honest, humans are visual creatures. Complex data is way easier to understand - and far more impactful - when it's presented in charts and graphs. Use visuals to make your key points pop and help stakeholders quickly grasp the event's success.
- Pie Charts are perfect for showing the breakdown of your audience demographics or budget.
- Bar Graphs are great for comparing metrics, like leads from this event versus last year's.
- Line Graphs can beautifully illustrate trends, like the spike in website traffic during the week of the event.
Think of it like an investor analyzing market performance. The S&P 500 has had wild swings, with a 30.88% return in a boom year like 1997 and a -36.61% drop during the 2008 crisis. Showing your event’s performance against industry benchmarks or past results provides that same kind of crucial context. You can dig deeper into how historical trends inform this kind of analysis by exploring the average stock market returns.
Crafting the Narrative
This is the final, most important step: connecting all the dots with a compelling story. Your report needs to explain the "why" behind the numbers.
Explain how a specific pre-event strategy - like using our service to boost registrations - led to a lower cost-per-attendee. Show how your on-site engagement activities translated directly into higher-quality leads and, ultimately, closed deals.
This story-driven approach turns your report from a dry collection of facts into a powerful argument for the strategic value of what you do. It's how you get the recognition - and the investment - you deserve for your next big event.
Common Questions About Measuring Event ROI
Once you start digging into event ROI, you’ll find the same questions pop up again and again. It's totally normal. Moving from simple math to a truly strategic way of measuring your impact is a process, and these are the most common hurdles our community of event marketers face.
Think of this as your go-to troubleshooting guide. Just like a mechanic fine-tunes an engine, these answers will help you dial in your ROI strategy so you can confidently prove your event's value every single time.
How Do I Measure the ROI of a Free Event?
This is a big one. For free events, you have to shift your thinking from direct revenue to potential value. Since there are no ticket sales, the standard profit formula goes out the window. Instead, the "return" side of your equation is built on the business value you generated down the line.
Your main goal is to assign a realistic dollar value to your outcomes. Look at metrics like your average Customer Acquisition Cost (CAC), the total sales pipeline generated, or even the lift in brand engagement.
The trick is to connect your free event's results to a number that already means something to your business. For instance, if your free webinar brings in 20 qualified leads, and you know from your sales team that a qualified lead is typically worth $500 in potential revenue, you've just created $10,000 in value.
When you stack that projected value up against your total event costs, you get a clear, defensible ROI that proves your "free" event was actually a powerful business driver.
What Are Common Mistakes to Avoid When Calculating Event ROI?
It's easy to get the math wrong, and a few common missteps can completely torpedo the credibility of your ROI calculations. Avoiding these pitfalls is the key to presenting a true picture of your event's performance.
The single biggest mistake? Fixating only on immediate revenue. This completely ignores the long-term gold, like brand loyalty, customer retention, and pipeline growth, which is often where the real, massive returns are hiding.
Here are a few other critical errors to watch out for:
- Forgetting Indirect Costs: So many marketers only track the obvious expenses. They forget to account for things like the internal staff hours spent planning and executing the event. This oversight leads to an artificially inflated ROI that just isn't real.
- Lacking Pre-Event Goals: If you don't set clear goals and KPIs before the event, you have no real way to measure success. You can't hit a target you never set.
- Using Bad Tools: Trying to track everything in manual spreadsheets or with a patchwork of disconnected systems is a recipe for disaster. It almost always results in incomplete or inaccurate data, making your entire ROI calculation unreliable from the start.
How Soon After an Event Should I Calculate ROI?
Calculating event ROI isn't a one-and-done task you check off the day after. The true impact of an event almost never reveals itself in the first 24 hours.
You should absolutely do an initial assessment right after the event wraps. This first pass lets you measure direct revenue against your costs and get a quick snapshot of how things went. It's your gut check.
But the real, meaningful analysis needs more time to bake. The full story of your event's value unfolds in stages:
- 3 Months Post-Event: By now, you can start to see initial lead conversions and real movement in your sales pipeline.
- 6 Months Post-Event: For many industries, this is the sweet spot. You can now track a significant portion of the sales cycle and see who's getting serious.
- 12 Months Post-Event: This gives you the most complete picture. You can see the full sales cycle play out and identify how many of those event leads actually became long-term, paying customers.
This phased approach tells a far more accurate and compelling story of your event's long-term business value.
What Is a Good ROI Benchmark for Events?
We wish there was a magic number, but there’s no single, universal benchmark for event ROI. What's "good" completely depends on your industry, your specific event goals, and whether you're hosting a lead-gen webinar or a massive customer conference.
That said, a commonly cited target across marketing is a 5:1 ratio, which works out to a 400% ROI. This simply means you aim to generate five dollars in value for every one dollar you spend.
A much more strategic way to think about it is to benchmark against yourself. Compare the Customer Acquisition Cost (CAC) from your event to your other marketing channels. If your event CAC is lower than your paid search or content marketing CAC, you have hard proof that your event was a highly efficient investment.
Ultimately, the best benchmark is your own past performance. The goal should always be to improve on what you did last time, proving that you're getting smarter and more effective with every event you run.
At Add to Calendar PRO, we know that a huge part of your ROI depends on one simple thing: people actually showing up. Our reliable, customizable Add to Calendar buttons integrate seamlessly into your marketing to slash no-show rates and protect your investment. See how we can help boost your attendance.